Attrition Rate: Formula, Benchmarks & Reduction Strategies (2026)
U.S. voluntary attrition averages 13% (Mercer 2025). Learn the formula, industry benchmarks, and 7 proven strategies to cut unwanted turnover.
U.S. voluntary attrition averages 13% (Mercer 2025). Learn the formula, industry benchmarks, and 7 proven strategies to cut unwanted turnover.
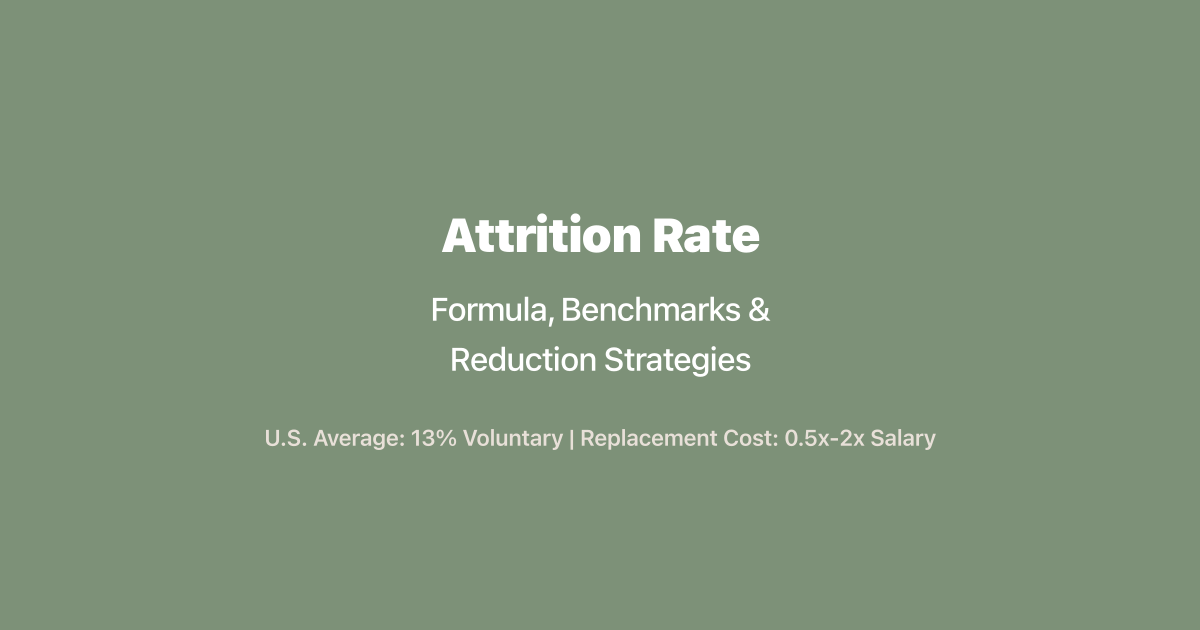
Attrition rate measures the percentage of employees who leave an organization over a set period - and for most U.S. companies, it sits around 13% annually for voluntary departures, according to Mercer's 2025 US Turnover Survey of 2,617 organizations. That's a meaningful improvement from 24.7% in 2022, but every percentage point still costs real money. Gallup estimates that replacing a single employee costs 0.5x to 2x their annual salary - and voluntary departures cost U.S. businesses roughly $1 trillion per year collectively.
Whether you're an HR leader trying to forecast headcount, a recruiter filling the gaps attrition creates, or a people analytics team building retention dashboards, this guide covers everything you need: the formula, current benchmarks by industry and job level, what drives people to leave, and seven strategies that actually reduce unwanted attrition.
TL;DR: Attrition rate = (separations / average headcount) x 100. The U.S. average voluntary rate is 13% (Mercer 2025), but ranges from 8.2% in insurance to 26.7% in retail. Replacement costs run 0.5x-2x salary. Seven proven reduction strategies - from structured onboarding to internal mobility - can cut attrition significantly. The biggest driver? Lack of career development (McKinsey).
Attrition rate is the percentage of employees who leave an organization during a specific time period and whose positions are not immediately backfilled. That last part matters. While "attrition" and "turnover" are often used interchangeably, AIHR notes a technical distinction: attrition refers to departures where the role is left open or eliminated, while turnover implies the position gets filled with a new hire.
In practice, most HR teams and analysts use the terms synonymously. What matters more is understanding the types of attrition and tracking them separately:
Not all attrition is bad. Losing low performers or employees in roles being automated can be healthy. The problem is regrettable attrition - when your best people walk out the door and take institutional knowledge with them.
The standard formula used by SHRM, Mercer, and most HRIS platforms is straightforward, according to AIHR:
Attrition Rate (%) = (Number of Separations During Period / Average Number of Employees During Period) x 100
Where average headcount = (employees at start of period + employees at end of period) / 2.
Say your company started March with 500 employees and ended with 485. During March, 20 employees left (5 were laid off, 15 resigned).
Don't just multiply a monthly rate by 12. That oversimplifies because it ignores compounding and seasonal variation. Instead, apply the formula across the full 12-month period using total annual separations and the average headcount for the year. If you must annualize a single month (say, for board reporting), use this adjustment:
Annualized Rate = 1 - (1 - monthly rate)^12
This accounts for the compounding effect and gives a more accurate projection than simple multiplication.
Count all permanent employee separations: resignations, terminations, retirements, and deaths. Exclude temporary/contract workers, internal transfers (they didn't leave the organization), and employees on leave of absence. If you're tracking voluntary attrition specifically, exclude layoffs and terminations from the numerator.
The average U.S. voluntary turnover rate dropped to 13% in 2024-2025, down from 17.3% the prior year, per Mercer's 2025 survey. But that average hides enormous variation across industries. Retail and wholesale leads at 26.7% - more than triple the 8.2% rate in insurance.

| Segment | Voluntary Turnover Rate | Source |
|---|---|---|
| Retail & Wholesale | 26.7% | Mercer 2025 |
| Tech (Europe) | 17.4% | Ravio 2026 |
| All-Industries Average | 13.0% | Mercer 2025 |
| Engineering Function | 12.0% | Ravio 2026 |
| Insurance / Reinsurance | 8.2% | Mercer 2025 |
| Executives | 5.2% | Mercer 2025 |
SHRM's 2025 Benchmarking Report paints a similar picture from a different angle: the median voluntary turnover across 2,371 organizations was 9%, while the average hit 13%. The gap between median and average tells you something - a minority of organizations with very high churn pull the average up significantly.
Mercer's data also breaks attrition down by organizational level, and the pattern is intuitive - the higher the role, the lower the turnover:
This makes sense. Executives have more invested in their roles (equity, relationships, status) and face fewer alternative opportunities. Front-line workers face lower switching costs and often leave for marginal pay increases.
There's no universal answer, but a few guidelines help. Rates below 10% are generally considered healthy for knowledge-work industries. For retail and hospitality, 15-20% is more realistic. Extremely low attrition (below 3-4%) can actually signal stagnation - a lack of new perspectives entering the organization.
The goal isn't zero attrition. It's minimizing regrettable attrition while maintaining a healthy flow of talent.
Replacing an employee costs between 0.5x and 2x their annual salary, according to Gallup. But those multipliers vary dramatically by seniority. SHRM research (2024) breaks it down further: entry-level positions cost 30-50% of annual salary to replace, mid-level roles cost 125-150%, and highly specialized or senior roles can run up to 400%.

And those are just the direct costs. SHRM notes that 60-70% of total attrition costs are hidden indirect expenses: lost productivity during the vacancy, reduced team morale, knowledge drain, customer relationship disruption, and the learning curve of new hires.
A concrete example: a 100-person company paying an average salary of $50,000 with 13% annual attrition would see 13 departures per year. At Gallup's conservative 0.5x-2x range, that's $325,000 to $1.3 million in annual replacement costs alone - before counting productivity losses.
This is why tracking recruiting KPIs tied to retention matters as much as tracking time-to-fill or cost-per-hire. The cheapest hire in the world is expensive if they leave in six months.
The #1 driver of voluntary departures is lack of career development and advancement - not pay, not benefits, not workload. McKinsey's research identifies four primary drivers, and they've remained remarkably consistent even as the post-pandemic labor market has cooled.
Here's the painful part: Gallup found that 52% of voluntarily departing employees said their organization could have done something to prevent them from leaving. And 51% said no manager or leader had discussed their job satisfaction or future with the company in the three months before their departure.
That's not an attrition problem. That's a management problem with a measurable cost.
U.S. employee engagement hit a 10-year low in 2024 - just 31% of workers reported being engaged, while 17% were actively disengaged, according to Gallup (January 2025). The areas with the sharpest declines were clarity of expectations (dropped from 56% to 46%), feeling cared about at work (47% to 39%), and development opportunities (36% to 30%).
Globally, Gallup estimates that disengaged employees cost the world economy $8.9 trillion in lost productivity - roughly 9% of global GDP. When engagement drops, attrition rises. They're two sides of the same coin.
Pin's AI scans 850M+ profiles to find candidates who match both skills and culture - try it free.
Seven evidence-backed interventions can meaningfully cut voluntary departures: internal mobility extends tenure by 41% (LinkedIn), hybrid work reduces resignations by 33% (Stanford/PNAS, 2024), and high-quality recognition programs lower two-year turnover risk by 45% (Gallup-Workhuman, 2024). The research consistently points to structural changes that address the real reasons people leave - not perks.
Lack of growth is the #1 attrition driver (McKinsey), and the fix has clear ROI. LinkedIn data shows that employees at companies with high internal hiring rates stay 41% longer on average - 7.4 years compared to 4.1 years at companies with low internal mobility.
What this looks like in practice: structured career pathing conversations (quarterly, not just during annual reviews), visible internal job boards, mentorship programs, and stretch assignments that let people build new skills without leaving the company.
Early attrition is a massive leak in most hiring pipelines. Research compiled by AIHR shows that 22% of workers have left a job within the first 90 days, and 60% of those early departures cite lack of training as the reason.
Conversely, Gallup found that managers who actively engage in onboarding produce new hires who are 3.4x more likely to describe their experience as exceptional. Onboarding isn't a one-day orientation - it's a 90-day (minimum) structured process that sets expectations, builds relationships, and ramps productivity.
A Stanford study published in PNAS (June 2024) found that shifting from full-time office work to a hybrid schedule reduced resignations by 33%. That's not a marginal improvement - it's a third fewer people walking out the door.
Meanwhile, McKinsey found that 17% of workers who recently quit did so specifically because their employer changed office policies (typically return-to-office mandates). Flexibility isn't a perk anymore. It's a retention tool with measurable impact on attrition.
A 2024 Gallup-Workhuman longitudinal study of approximately 3,500 employees found that well-recognized workers are 45% less likely to have turned over after two years and 65% less likely to be actively job-seeking. They're also 9x more likely to be engaged.
The problem? Only 22% of employees report receiving the right amount of recognition - a number that hasn't budged since 2022. Recognition doesn't have to be expensive. It needs to be frequent, specific, and tied to the behaviors and outcomes the organization values.
With only 30% of workers highly satisfied with their pay (Pew Research, December 2024), compensation remains a core attrition driver. But it's not always about paying the most - it's about paying fairly and transparently.
Conduct annual compensation benchmarking against market rates. Share pay bands openly. Address compression issues proactively (when new hires earn more than tenured employees in the same role). Salary transparency laws in states like California, New York, and Colorado are accelerating this shift whether companies are ready or not.
Poor leadership is McKinsey's #3 attrition driver, and it's the hardest to fix because it requires changing behavior, not just policy. But the data is clear: when Gallup tracked engagement declines from 2020 to 2024, the sharpest drops were in manager-dependent areas - feeling cared about at work (47% to 39%) and clarity of expectations (56% to 46%).
Train managers to hold regular one-on-ones, provide career development support, and have stay conversations (proactive retention check-ins) rather than only learning why someone left during an exit interview. Remember: 51% of departing employees said no leader discussed their satisfaction in the three months before they left.
The best retention strategy starts before day one. When you hire candidates who genuinely fit the role, the team, and the trajectory of the company, they stick around longer. Poor job fit is an upstream cause of attrition that no amount of perks or retention programs can fix downstream.
This is where AI-powered recruiting tools make a measurable difference. Pin's AI matches candidates against role requirements across 850M+ profiles, and the results speak for themselves: approximately 70% of candidates Pin recommends are accepted into customers' hiring pipelines, and recruiters using Pin fill positions in roughly 2 weeks. Better matches, faster.
As Rich Rosen, Executive Recruiter at Cornerstone Search, puts it: "Absolutely Money maker for Recruiters... in 6 months I can directly attribute over $250k in revenue to Pin." When you're placing the right people in the right roles, they stay - and so do your clients.
Reduce attrition by hiring better-fit candidates with Pin's AI →
Knowing your overall attrition rate is a start, but it's not enough for actionable decision-making. The most effective people analytics teams segment attrition data to identify patterns and target interventions where they'll have the most impact.
Track monthly, report quarterly, benchmark annually. Monthly tracking catches spikes early. Quarterly reporting gives leadership enough data to act without drowning in noise. Annual benchmarking against industry data (Mercer, SHRM, BLS) tells you how you compare to the market.
Build a simple retention dashboard that shows: overall attrition rate (trailing 12 months), voluntary vs. involuntary split, attrition by department and tenure band, 90-day attrition rate (early turnover), and cost-of-attrition estimate. If any metric trends above your industry benchmark for two consecutive quarters, flag it for a root-cause analysis.
The broader labor market context matters for understanding your own attrition. The U.S. monthly quit rate fell to 1.9% in February 2026, according to the Bureau of Labor Statistics JOLTS data. That's well below the 3.0% peak during the Great Resignation in November 2021 and even below the 2024 annual average of 2.1%.
What does this mean? Workers are quitting at the lowest rate in years. The labor market has cooled. But don't confuse lower quit rates with higher satisfaction. Gallup's engagement data shows employees are less engaged than they've been in a decade. Many are staying in place not because they're happy, but because they perceive fewer opportunities. When hiring picks up again, companies with unresolved retention problems could see a delayed attrition surge.
For the full 2024 picture: the BLS annual averages show a total separations rate of 3.3% monthly - composed of 2.1% quits, 1.1% layoffs and discharges, and 0.2% other separations.
These three terms get mixed up constantly, so here's a quick reference:
| Metric | What It Measures | Formula |
|---|---|---|
| Attrition Rate | Employees who leave and aren't replaced | (Separations / Avg Headcount) x 100 |
| Turnover Rate | All employee departures (replaced or not) | (Departures / Avg Headcount) x 100 |
| Retention Rate | Employees who stayed over a period | ((Headcount End - New Hires) / Headcount Start) x 100 |
In practice, most organizations use "attrition" and "turnover" interchangeably. And that's fine for operational purposes. What matters is consistency - pick a definition, apply it the same way every period, and make sure everyone reading your reports understands what the number means.
Retention rate is simply the inverse perspective. If your annual attrition rate is 13%, your retention rate is roughly 87%. Some HR teams prefer to report retention because it frames the story positively, but the data underneath is identical.
A good attrition rate depends on your industry. For knowledge-work sectors, below 10% annually is generally healthy. Retail and hospitality companies often see 20-25% as normal. Mercer's 2025 data shows the U.S. average voluntary rate at 13%, so anything consistently below your industry's average suggests effective retention practices.
Divide the number of employees who left during the month by the average number of employees that month, then multiply by 100. For example, if 10 people left from an average headcount of 500, your monthly rate is 2.0%. To annualize, apply the full-year formula rather than simply multiplying by 12.
Technically, attrition refers to departures where the role isn't backfilled (headcount shrinks), while turnover includes all departures whether the role is filled or not. In practice, most HR teams and analytics platforms use the terms interchangeably. SHRM, Mercer, and BLS all report "turnover" data that encompasses both scenarios.
Every employee departure creates a requisition that recruiters must fill. At a replacement cost of 0.5x-2x annual salary (Gallup), high attrition drains recruiting budgets, extends time-to-fill, and forces teams into reactive hiring mode. Reducing unwanted attrition frees recruiters to focus on strategic employer branding and proactive talent pipeline building instead of backfill firefighting.
Yes, in two ways. First, AI-powered recruiting tools improve candidate-role fit from the start, reducing early attrition caused by mismatches. Pin's candidate acceptance rate of approximately 70% reflects this precision. Second, people analytics platforms use AI to identify attrition risk signals - disengagement patterns, compensation gaps, manager effectiveness - so HR can intervene before employees decide to leave.
Hire better-fit candidates and reduce attrition with Pin's AI recruiting →